4 Ways to Help your Business Succeed Using Data and Analytics

Transformation: The Future of Finance is Here
There is a Transformation happening in the office of Finance. Finance leaders are becoming the partners to our businesses we have always wanted to be. Finally, we’re not at the back of the bus anymore! We’re doing real-time analysis, driving current business decisions. All this data we now have access to is changing the game. We have real-time data, can drill down from our dashboards to analyze variances, and we have all the information we need at our fingertips to make the right decisions at the right time. Our teams just push a few buttons and make it all happen.
RIGHT?
You can all drill down into your data by customer, by product. Slice and dice as you need. You have answers for the challenges your business is facing. It’s seamless.
RIGHT?
NOT anywhere I’ve worked.
EVER.
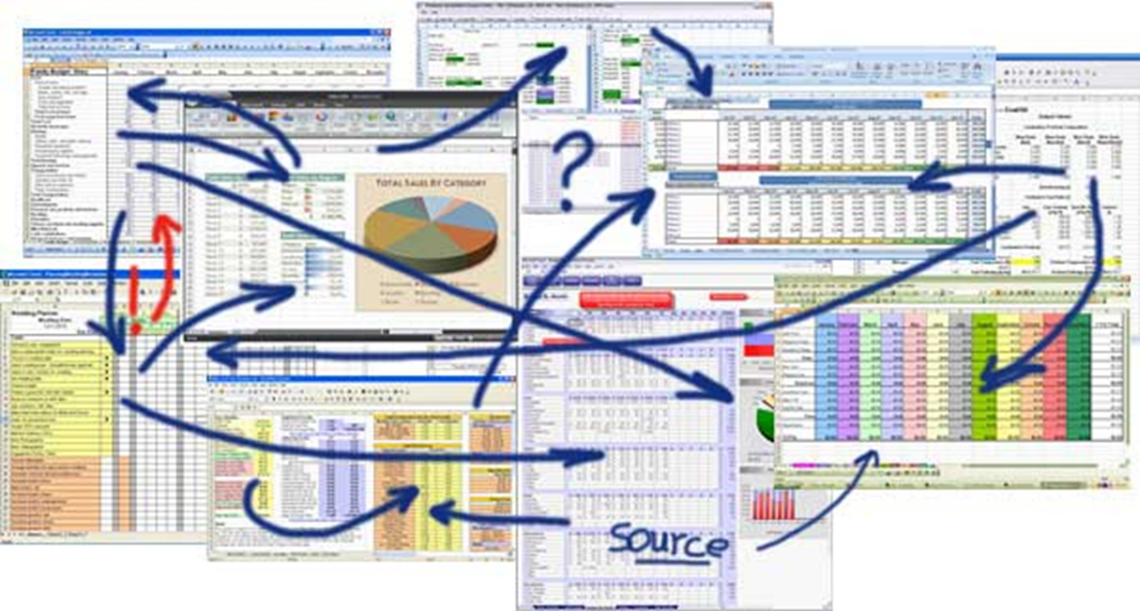
More like Spreadsheet Inc. or Excel Hell as most of us in Finance like to call it…..
Reality Check
Even though we have implemented a whole lot of great tools, each department still has their own set of numbers, excel workarounds and data-jockeys that do all the manipulations that the system doesn’t do. Sales has their set of numbers (somehow always the most optimistic!), Operations has a different set, and none of them tie to what Finance reports a few weeks later when the month gets closed. Each department argues about who’s right, and the loudest voice usually wins, or we just move on because there’s a new fire to put out.
Sound familiar?
Some of you may be living that reality. For some it may not be as bad, and for the lucky few you may have transitioned past that to a state where at least most of your data comes from one place and you know it’s right.
Because that’s the goal.
One source of the truth. Accurate. On time. Efficient.
It really shouldn’t have to be so hard.
RIGHT?
But I can tell you it has been just that hard in EVERY business I have led a Finance Transformation project– and that includes businesses from $40M to $1Billion.
And Gartner backs that up with data.
A whopping 87% of companies are classified as having low data and analytics maturity.
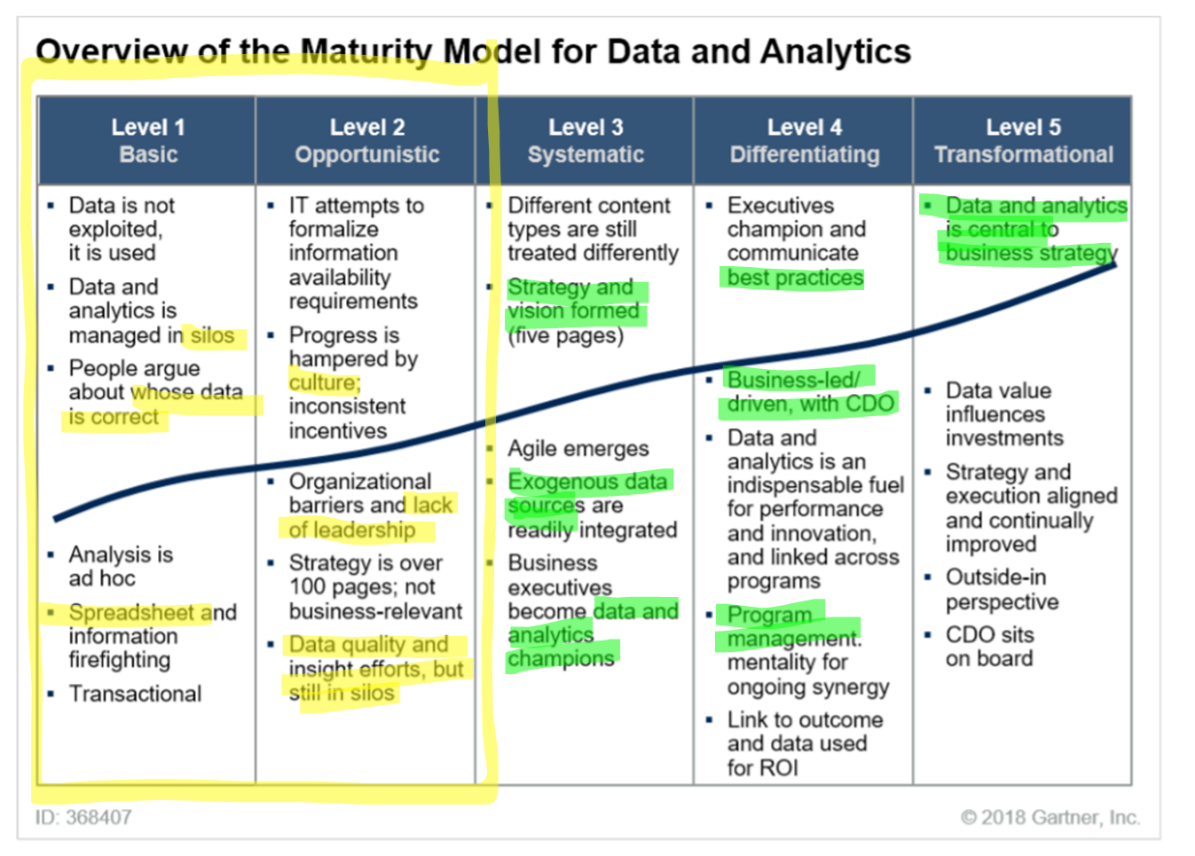
That is incredibly HIGH given its 2019!
How do you know if your business is low in Data & Analytics maturity?
Characteristics of low Data & Analytics maturity
- Data is managed in silos
- Teams argue about whose data is correct
- Analysis is done last minute in spreadsheets
- Leaders don’t understand data
- Firefighting culture
What does that mean in your day-to-day? You have multiple systems that kick out lots of canned reports, but when you have critical decisions to make, you are still using pivot tables and unreliable Excel spreadsheets to get quick answers.
Sound familiar? You’re not alone!
Why is it so hard to Implement Data Analytics?
The key success factors you need to get buy-in to get started, are the very things you need to build.
You need to gather business requirements to justify your investment in resources and tools, BUT:
- Business users are disengaged
- Lack the budgeting, staffing, experience and collaborative approach
- Struggle with poor data quality, inconsistent processes and data silos
- IT infrastructure doesn’t meet business needs
How do you get the business to understand and support the need to invest in data analytics? How do you do it without spending large amounts of money up front? Since your business doesn’t understand and support data analytics, they aren’t willing to invest in it….YET!
So How Do You Get Started?
Gartner published an in-depth article* in 2018 identifying the key steps that will help your business improve it’s Data and Analytics capabilities. This article shares the key steps with practical Finance examples and how you can implement them in your business today. read more…
Four Steps to Improve Data & Analytics capabilities:
- Develop a Data Analytics STRATEGY that solves BUSINESS problems
- Leverage EXISTING business RESOURCES to build capabilities
- GOVERN high impact DATA that causes the most problems (20/80)
- Choose TECHNOLOGY that supports broad BUSINESS needs
Step 1: Start with the BUSINESS Strategy

Develop a Data Analytics STRATEGY that solves BUSINESS problems
Your Business isn’t interested in a Data Strategy. Your business is interested in Making Money. Help your business make more money by creating data analytics that solve business problems.
Show Your Business the Money!!!
Identify REVENUE drivers that need BETTER data
Gross Margin by customer is a great place to start. Look at the analytics the sales team are using and see how they can be improved. Do the gross margin reports include all variable costs (commissions, rebates). Are they broken down in the correct categories/ sub-categories. Is trend analysis being done?
What Data ISN’T there – and how can you add it?
Solve a data problem for the sales team that helps them make more money – and they will support your data analytics strategy!
Identify PAIN POINTS that need better data
Most of the time departments are forecasting with the best data they have. Not necessarily the best data the company has. Just whatever file was handed down from the last person who did the job.
Inventory forecasts are a great example of this. Using standard reports based on the last 12 months of sales to replenish inventory. The business doesn’t have sophisticated demand planning tools that link in the latest sales forecasts and break them down to inventory skus.
And in rapidly changing markets, inventory orders based on the last 12 months are going to be wrong. TOTAL inventory has stayed the same, but now your business is SHORT on the inventory it needs, and very LONG on what it doesn’t need.
Customers are screaming and nobody knows why!
You can help provide answers with analytics to show average days on hand by category and show why better analytics will lower inventory with more accurate buying, increase sales and make customers happy!
Identify WASTE in hidden factories
What is a “hidden factory” ? A hidden factory is wasted work that you can’t see. According to Harvard Business Review, knowledge workers waste 50% of their time hunting for data, finding and correcting errors, and searching to confirm data they don’t trust.
50%!!!
The Sales Team provides a forecast to the Finance team. They know it’s overstated, so they override the numbers they don’t believe. Or they look for another source. Go back and review the data with the team and push them for more data. Then when the Finance forecast comes out, the Sales VP doesn’t agree with it, and the 2 teams have to go back and reconcile why the numbers don’t agree.
Sound familiar?
When departments don’t use a single source of the truth for their reporting, forecasting and analysis, then they will waste time reconciling their results with the results another team created using different processes and different data.
This is WASTE you can eliminate.
Get Started!
Start with a small project in one of these areas. Look for Pain Points and find ways to solve them (they’re not hard to find – everyone is usually complaining about them!) Build partnerships with Business Leaders by helping them MAKE or SAVE money! The whole point of this work is to start building relationships with the business – to understand what helps them accomplish their strategies.
Start small, build trust and get a WIN. Then do it again and again!
Step 2: Start with the Resources you Have

What’s the first thing we want to do when we kick off a new project?
Ask for more resources! RIGHT?
Don’t do it! If your business doesn’t believe strongly in Data & Analytics, asking for the funds to invest in an expensive new resource before you add any value could stop your project before it gets off the ground.
So how do you get all the extra work done?
Find Existing Business Resources
Just because you aren’t doing data analytics for the business – someone is. There are data jockeys hidden in your business somewhere providing the Sales team or the Executives with reports when the Finance team is busy with month end. Those reports might not tie to anything, but that doesn’t stop them from being used!
- Who builds key reports for the business?
- Who is the go-to person for data firefighting?
Go find them! These are people who understand the product and customer hierarchy. People who know how to get data and do the manipulations needed to make it work. You can often find them in IT, Sales, Customer Service, Marketing or Supply Chain.
These are your resources to START
There is no downside to finding these resources and bringing them onto your team (even if just informally). If they are strong analyts, they will appreciate being aligned with the Finance team and getting coaching and support from a leader who understands the value of data. If they are weak, coach them and make them better. And if all else fails, you can highlight to the business the need to upgrade a weak resource.
Take control of the root cause of many hidden data factories by building quality in at the beginning of the process, and eliminate unnecessary reconciliations at the end.
That’s a WIN either way!
Step 3: Only Govern Critical Data

The First Rule of Data Governance, Is Don’t Talk about Data Governance!
Nothing scares business people away faster than a meeting about Governance. So keep it simple. Focus on how to keep your data clean. If the business doesn’t think it’s a priority – remind them “Garbage In = Garbage Out”.
To get started, answer the following few questions:
- WHAT data do you have? Identify tables, spreadsheets, reports, and dashboards that are critical to the business
- WHO is using the data, and what controls are in place
- GOVERN only critical data (20/80) that caused PROBLEMS in the past
- Start with basic rules to lay a good foundation
- E.g. new customers/vendors/product data
- Executive sponsorship is critical to making governance work. At some point the business will want to skip key controls because there is an urgent business need. You need to remind them what happened in the past when you skipped controls, and how much pain it caused. It takes discipline and practice to do things right the first time.
Step 4: Implement Technology after you ADD VALUE

When do we bring in Technology?
- Add TECHNOLOGY when you have something valuable to automate!
As you worked through steps 1 – 3, you:
- Learned about your business priorities – now you know where the MONEY is!
- What data you need to make or save money
- You’ve identified resources that can help
- You started cleaning up and governing your data
And NOW you are ready to create some analysis to Add Value. Leverage your existing tools to build a draft report. If you have a CPM tool like Prophix, you will already have the capability to create new reports and analysis using multiple sources of data. Build the demo in Excel if that’s all you have.
Ask for Investment AFTER you Show the Business the Money!
Before you make an investment in tools, make sure you build something useful that helps the business MAKE or SAVE Money. Build it manually first, and if successful, getting approval for further funding to automate will be easier because you will have business support.
Implement tech that has multiple use-cases to gain wider support
You can only go to the well for investment for systems so many times before you get a hard NO! So make your investments count. Invest in systems that can be used in many use-cases. Invest in CPM solutions that are easy to implement and can be done in stages, so that the investment can be phased to match your cashflow.
Cheat Sheet Summary:
4 Steps to Improve Your Analytics Capability
- Start with the BUSINESS STRATEGY ($$$)
- Data Analytics should be focused on critical business goals and problems
- Start with the RESOURCES you have
- Find the people in the business who already understand your data
- GOVERN critical DATA that causes the most problems (20/80)
- Start with basic controls over key customer, vendor and product data
- Implement TECHNOLOGY after you have added VALUE
- Build pilot reports and analytics with tools you have, and invest in more technology when there is a payback
Want to Learn more?
Register now for the Prophix webinar and learn step by step how to implement this approach in your own business.